

The Declining Cognitive Ability of Contemporary Youth
A Historical Examination of Standardized Test Scores

There are several positive youth trends that should be celebrated; “kids these days” are less likely to drink alcohol, use illicit drugs,1 become pregnant, and commit crime than previous youth cohorts. In general, the youth of today are less likely to engage in risky and dangerous behavior than in the recent past. While some concerns have been expressed about their lack of independence and deteriorating mental health, teenagers are generally entering early adulthood in a good position to be productive members of society.
Well, sort of. A recent New York Times article has highlighted a problem that has existed just outside of the mainstream public conversation for nearly a decade. The biggest problem with kids today is: they can’t read. Or, at the very least, they are less likely to read at grade level than they were a decade ago.
This is not the first time that there have been deep concerns about declining test scores. Many commentators noticed that SAT scores were dropping during the 1960s and 1970s. At the time, the decline was a mystery - partially attributed to a larger and more diverse group of test-takers than during eras past. While a less-academically gifted student body taking the SAT may have played some role in the declining trend, it is also likely that environmental lead exposure during youth among Baby Boomers and Gen X contributed to a general decline in cognitive ability among the teenagers of the mid-1960s through late 1980s. Has the smartphone generation experienced a similar cognitive decline?
Although some distinction could be drawn between performing well on standardized tests and ‘pure’ cognitive ability, it is not entirely clear that the recent decline in school performance is simply a failure to ‘teach to the test.’ While it is certainly true that 2020-2021 educational environment inhibited learning, the decline in student performance predates COVID. Additionally, if students do not achieve key learning milestones, they may miss their opportunity to ever acquire these cognitive skills. The declines we have seen are not just temporary “blips” in the data.
Declining Cognitive Ability?
It is possible that the current generation of kids has less ability to pay attention in school. Given their early and frequent exposure to smartphones, iPads, social media, and online gaming, the ability to concentrate and persist in the lower-stimulation school environment may be a challenge.
There are some indications that ADHD symptoms have been increasing, including a spike in diagnoses after the pandemic. And now, with the rise of using (cheating with?) AI, the distance between performance in school and scores on standardized tests may be at an all-time high. An environment filled with constant scrolling, online-induced dopamine hits, and homework-completing robots may be toxic to a child’s cognitive ability.
Some have argued that the cognitive performance decline among youth has been relatively small, but that contemporary students have less desire to learn. But, even in this account, the description of declining persistence with boring educational tasks implies that students have less self-control; the kids today appear to be less able to pursue tasks that involve delayed gratification.
But, just how bad is it? To put the recent academic recession into historical context, I compare trends in SAT and ACT scores.
1. ‘Standardized’ Tests have Changed over Time
There are some caveats in making these historical comparisons of exam scores. The ‘standardized’ tests that are administered today are not the same tests that were administered in the past. Not only are different questions posed in different iterations of the exam, the scoring has changed over time; the score on theses standardized exams today is not directly comparable to the initial versions of these tests.2
This lack of historical comparability is common of ‘standardized’ tests and exams measuring other cognitive dimensions, such as intelligence. Periodically, the IQ test has to be re-normed to converge around a population mean of ‘100’. The so-called ‘Flynn Effect’ suggests that each generation over the past century has performed slightly better on IQ tests, which necessitated a periodic scoring adjustment.
The SAT has went through three major iterations since the 1950s. Each time that the scoring of the SAT has been changed, the ‘raw’ score was increased for presumably similar performance on the exam. If you examine each of these individual trends within the same scoring system, test scores have declined.
The ACT has also went through (at least) two scoring shifts since it was introduced in the 1970s. The upward shift in raw scores, but decline in performance over time, was also apparent within the ACT.
Given these changes in scoring, I attempt to standardize the scores below. I calculated the mean proportional annual change across SAT/ACT test scores among exams scored on the same scale. I then use this information about annual change to construct a singular metric over time. This method produced the standardized score presented below.
Using this metric, we see both the 1963-1983 decline noted previously as well as the 2010s/2020s decline that is of current concern. Without accounting for other relevant factors, we might say that students have never scored worse on these college entrance exams than they have during the last few years. Has each generation featured progressively less-academically prepared students?
2. The Population of Youth Taking the SAT/ACT has Changed
Probably not; the unadjusted score presented above likely over-estimates the historical decline in ‘average’ student achievement. A meta-analysis examining historical IQ scores has found that students attending college have become less academically exceptional over time. In the 1940s and 1950s, the IQ of college students was a standard deviation above the population mean. By the 2020s, the average college student only scores a few points higher on an IQ test than the average non-college student.
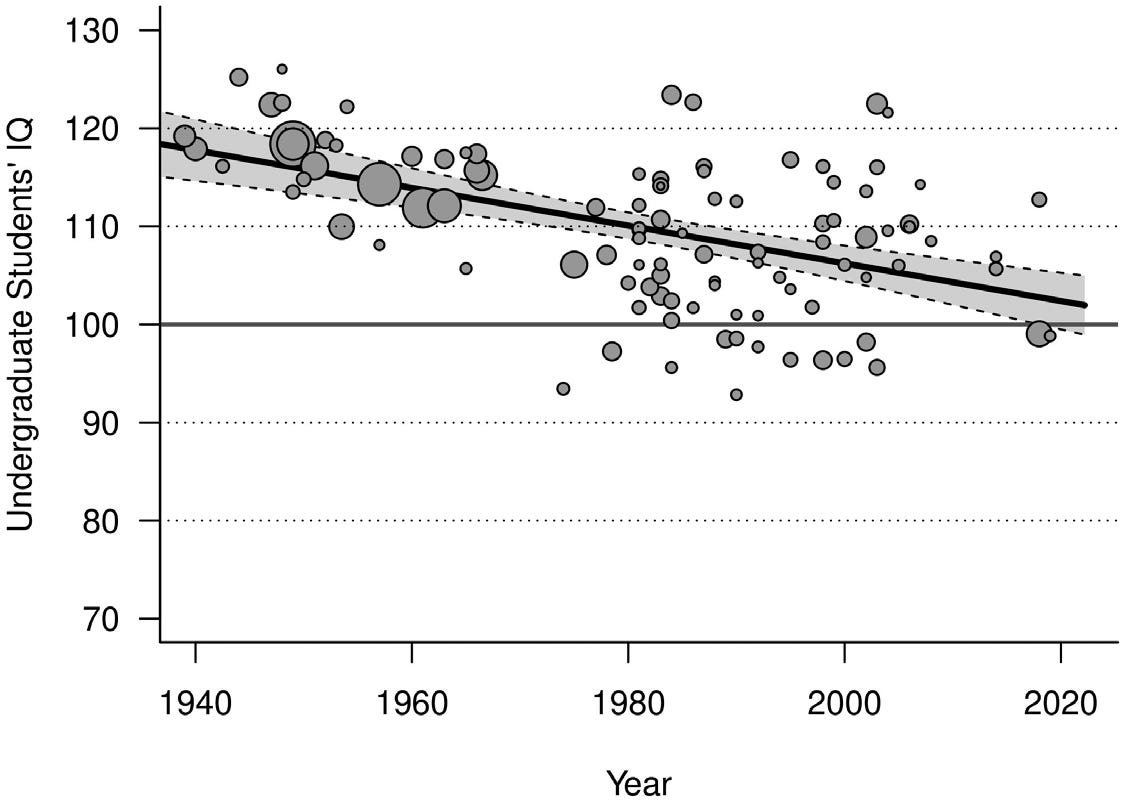
When the SAT was first introduced, only a small percentage of the population took the exam; during this era, it was often only the most academically gifted and affluent who would attend college. Today, there is less difference between the students who do and do not attend college in terms of academic aptitude. In recent years, some states have even mandated that all high-school students take a college entrance exam. Accordingly, it is not entirely fair to compare the self-selected test-takers of the 1950s and 1960s to those of today.
As an adjustment for the modern, less-academically gifted sample of college entrants, I regressed the standardized test score on two measures: the college attendance rate and the average undergraduate IQ.3 These metrics are examined under the assumption that as more students attended college, the academic aptitude of the average SAT/ACT test taker declines. (This was also the initial hypothesis for why SAT scores dropped during the 1960s/1970s.)
I then subtracted the ‘predicted’ value based on these regression models from the ‘actual’ score (calculating the “residual value”). This centers the standardized SAT/ACT score around ‘0’. Years with scores above ‘0’ represent eras when students over-performed expectations; scores below ‘0’ suggest under-performance even after accounting for the changing sample of test-takers.
Even after making these adjustments, the recent scores are still some of the lowest ever recorded. While simply controlling for a larger (less academically selective) student body may not fully account for the differences in the self-selected samples taking college entrance exams over time, these trends are suggestive that the recent decline in standardized test scores rivals that of the most lead-poisoned generations.
There are two related factors that suggest that recent scores may be even worse than depicted. First, only in the past few decades have accommodations been made for students with learning disabilities, who often receive additional time to take the exam. While it is true that students with learning impairments may have just not taken college entrance exams in eras past, thereby deciding to forgo higher learning completely, the lead-addled students of the 1960s-1980s did not receive this test-taking advantage.
Second, there has been some suspicion that students from affluent backgrounds, possibly without ‘actual’ learning disabilities, have been able to ‘game’ these accommodations to achieve better scores than if they had taken the exam under standard conditions. It is unclear to what degree allowing students additional time and breaks has impacted aggregate SAT/ACT scores.
Overall, it is hard to know exactly how to balance historical differences in exam scoring, exam-taker populations, and increasing accommodations against each other. This means that the results presented above are certainly alarming, but should be interpreted with some caution.
3. Examining Standardized Middle-School Test Scores
Given that there may still be differences in the population of students that we cannot fully account for over this time span, I display the results of an exam that faces fewer comparability issues. Unlike the self-selected nature of college entrance exams, nearly all elementary and high-school students are periodically required to complete standardized tests. Accordingly, this sample of exam takers should be fairly representative of the student body over time. The main limitation of these exams is the time series does not extend as far into the past as the SAT/ACT.
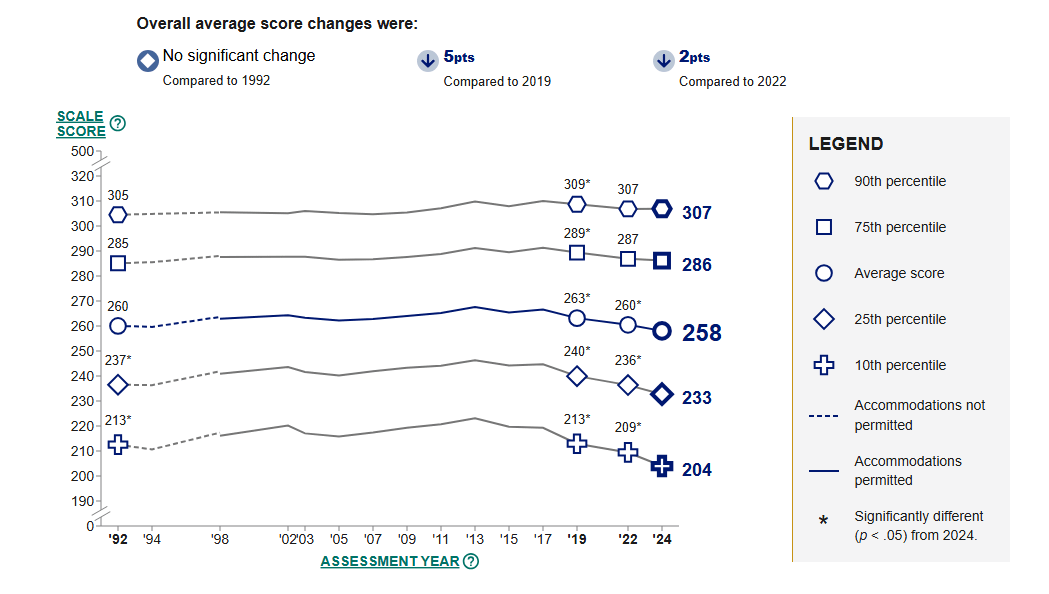
National NAEP Scores suggest a significant decline in academic achievement since circa 2010, but not as steep as ACT/SAT scores. Unlike the near all-time low 2023-2025 for SAT/ACT trends, standardized scores were often lower in the 1990s than they were in 2023 or 2024. Within these statistics, we can still see the steep decline over the past decade, but recent scores do not sink to the depths implied by the college entrance exams.
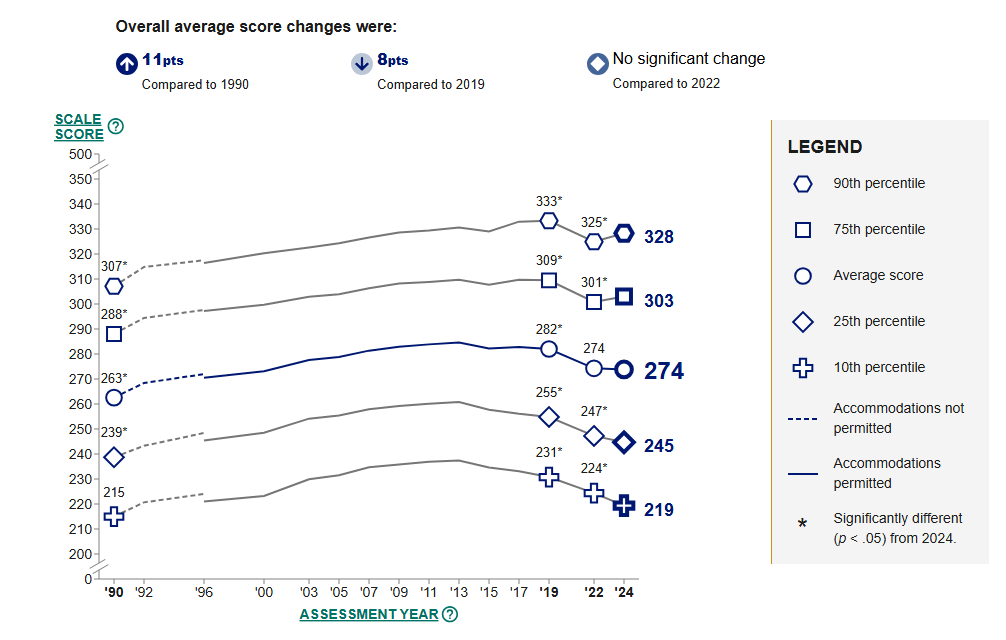
Eighth graders fared a little worse in reading than math in recent years, but were still similar to students of the early 1990s. However, especially among the lowest achieving students, there has been a troubling decline in reading scores.
4. Verdict?
There has been a decade-long decline in student achievement on standardized tests. It appears to be the largest drop in test scores since the generations with significant exposure to environmental lead. Yet, given the less dramatic decline among middle-school scores on standardized tests than the on SAT/ACT scores, this recent academic recession has likely not yet been quite as severe as that of 1963-1983.
This recent trend is suggestive of a decline in youth cognitive ability and self-control that cannot be easily dismissed as a fluke of the COVID learning environment. It is also a trend that cannot be reversed by simple changes to the curriculum. Getting students to be both willing and able to focus in school will take a comprehensive strategy that extends beyond the classroom.
Although - likely due to the higher toxicity of fentanyl, there was a recent increase in teen drug overdoses. Overall abuse trends seem to be declining, but not necessarily overdose fatalities.
The data for SAT scores can be found here and ACT scores can be found here. The standardized trend was calculated as the proportional annual change within a time series with ‘1’ as the starting point in 1952. There were three distinct SAT time series (six in total as both the ‘verbal’ and ‘math’ scores were examined separately) and two ACT time series (four in total, using the ‘English’ and ‘math’ scores). The annual change in each series was added together and then divided by the total number of series with complete data in a given year.
The college attendance data combines two historical NCES data sources: 1970-2024 and 1950-1970. Linear interpolation is used to calculate missing annual data and the 2025 data was calculated as a 1% increase based on this report. The college enrollment data were converted to a rate using the population aged 20 to 24.
The historical college IQ is calculated using the adjusted observations found in this meta-analysis, with the missing years between observations calculated using linear interpolation. The 2023-2025 data was extrapolated from the trend in the years prior to 2022.