

Explaining the Crime Decline
The definitive and authoritative account

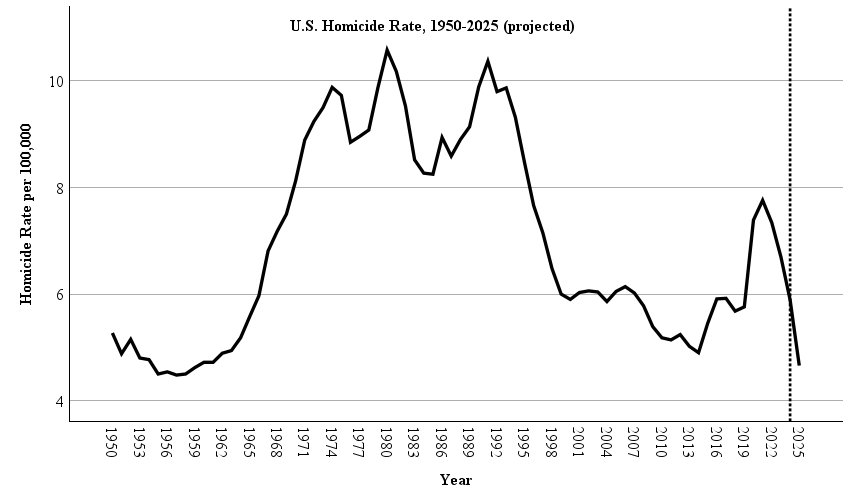
Since peaking in 2021, the homicide rate has plummeted each subsequent year. Data1 through May of 2025 suggests that the national homicide rate may end up as the lowest in more than 50 years. Using CDC Mortality data on fatal assaults, the homicide rate in 2025 is expected to be about 4.7 homicides per 100,000 population. This would be lower than in 2014 (4.9) and the lowest since 1959 (4.6). (Note that the CDC estimates are slightly higher than the FBI’s numbers.)
In the figure below, you can examine the homicide trend from 1950 to 2025 with this year’s data projected using monthly city data (indicated with the vertical line). The precipitous murder decline has shown no signs of letting up and will likely continue to sink even lower in the coming years.
The obvious question is: Why? Why are homicide rates plummeting to levels we have not seen in more than 60 years? I explain this trend in five parts below. To avoid re-litigating the entirety of 1990s decline, I will direct my focus on the 21st Century.
My basic thesis is that crime rates, other than murder, were largely falling throughout the 2010s and 2020s. The overall crime decline can largely be attributed to dramatic changes in the behavior of teenagers. Occurring at the same time, the rise (and decline) of homicide is due to some offense-specific factors (illicit drug markets, alcohol consumption, proliferation of handguns) that are now waning. The 2022-2025 decline in homicide is really a ‘correction’ to where the rate should be if we had not had a drug, alcohol, and gun-fueled murder wave. The truth is, the homicide rate’s increase during the mid-2010s and early 2020s defied historical precedent2; its recent decline does not.
Part 1. The Underlying Crime Decline
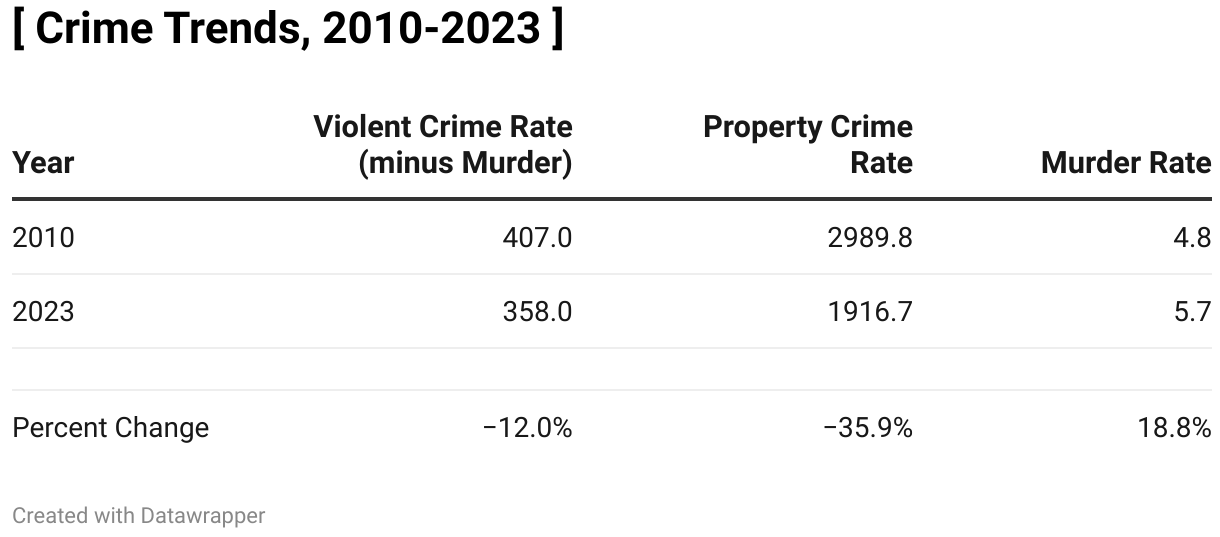
To begin, I will address why crime rates, other than homicide, have largely been declining. In the table below, I display the crime trends from 2010 to the latest year of available (national) data, 2023. Property crime has been in freefall and violent crime has declined significantly. However, as we will see, the muder rate took a slightly different path.
The Decline of a Youth Culture of Independence
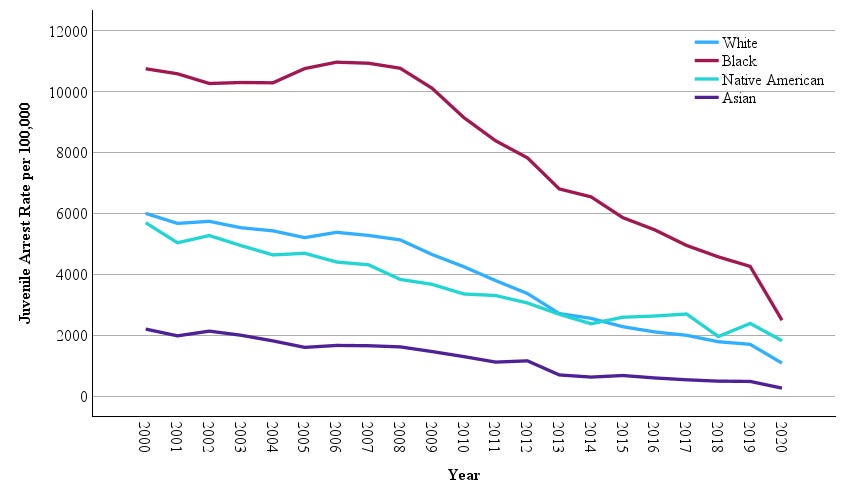
The story of the crime decline needs to start with the decline in youthful offending. Since the late 2000s, there has been a dramatic decline in youth offending. Below, using data from the Office of Juvenile Justice and Delinquency Program, we can see that the rate of juvenile arrests has declined for youth of all races from 2000 through 2020.
Probably the best overarching explanation is D. Wayne Osgood’s description of the decline of a youth culture of independence.3 The youth of today are less likely to spend time with their peers, away from adult supervision. They are less likely to obtain a driver’s license, drink alcohol, and have sex than teens in generations past. In general, the youth of today are less likely to take risks. Importantly for involvement in crime, their tendency to spend time alone, in their rooms, on their phones makes it harder to commit crimes IRL.
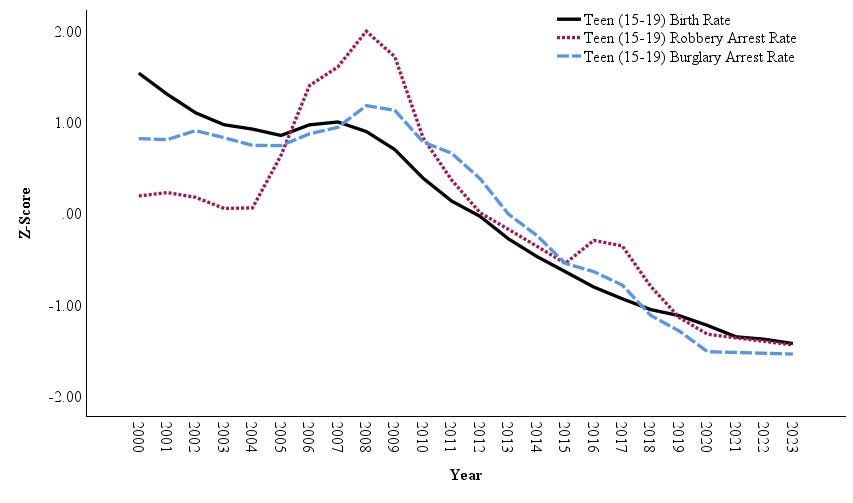
In the figure below, I display a one proxy of the decline of teenage independence: teenage birth rates. This trend is compared to trends in robbery and burglary arrests among youth (aged 15 to 19).4 Teenage birth rates have declined by a larger margin than that of adult women (20-49) and teenage arrest rates for crimes like robbery and burglary have closely followed this pattern. The convergence and decline of these trends highlight the underlying tendencies of today’s youth - taking fewer risks, spending more time alone, and living under the supervision of their parents and other adults. Even when teenagers do venture out, many parents monitor their locations on Life360 and other similar apps. Some youth may choose to offend anyway, but the modern teen panopticon makes this feel more risky.
Declining youth offending may also be related to other factors as well. Lower rates of childhood poverty, a smaller cohort size, declines in child abuse/neglect, less aggressive policing of the “drug war,” and greater school and parental attachment have all been cited as factors explaining variation in youth involvement in crime. I think some of these trends likely played a role as well. The headline explanation of the crime decline is the shift away from a youth culture of independence; a more comprehensive description is a cascading combination of crime-reducing societal practices and factors that cause today’s youth to be less criminally inclined.
The reason youth offending is central to the broader crime decline story is that if youth don’t begin offending, they are less likely to offend during adulthood. While I have previously documented that the ‘age-crime curve’ has flattened,5 all evidence still suggestions that people desist from crime as they age. The overall crime rate may fall even further as today’s teens age into adulthood.
The Opportunity to Commit Crime
A secondary story of the crime decline are changes in the ‘routine activities’ of property offending. There are fewer opportunities in general to make (street) crime pay. Scammers, cheats, and fraudsters are everywhere, but the potential payoff for burglaries and robberies are less plentiful. People don’t carry cash as often. The high-value items of today often have anti-theft technology embedded within them, making them more difficult to access for potential thieves. Many financial transactions have moved online with products delivered to the customer’s door, reducing the opportunity steal items directly after a purchase. These changes have helped to create new classes of criminals, such as the so-called “porch pirate,” but even these offenders face a greater possibility of being caught on a home security camera. It is getting harder to make (street) crime pay.6
Why are declines in crimes like robbery important in predicting homicide trends? Historically, a significant subset of murders were “robberies gone wrong.” Additionally, as the late Richard Rosenfeld argued, some of the same economic conditions that motivate “acquisitive crimes” like robbery and burglary produce homicides because they facilitate underground markets for stolen items - which are prone to violence.7 If burglary and robbery rates are in steep decline, we would usually expect the homicide trend to follow. But, it didn’t, at least not during the past decade.
Part 2. The (Unexpected) Homicide Epidemic
The national homicide rate increased at the same time that overall crime rates fell. This is the era that I described as the ‘homicide epidemic’ in my recent book, Crime Wave. Since I have written extensively about this elsewhere, I will keep this section brief, mostly presenting the underlying trend data. The figure below shows the de-coupling of the robbery and homicide trends circa 2015. We have recently seen some re-convergence in the projected 2024 and 2025 data.8
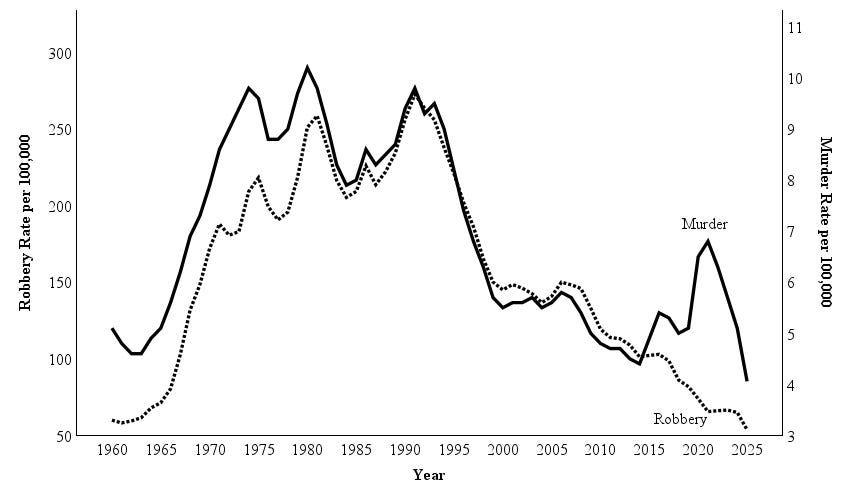
Why did homicide rates rise? The combined effect of an out-of-control fentanyl epidemic, increasing alcohol consumption, and greater access to handguns. Beginning with drugs, the fentanyl crisis marked a shift in the opioid epidemic. As drug abuse moved from rural areas into run-down urban centers, in the hands of drug dealers rather than pharmacists, it became more violent. Also, more people under the influence of drugs and alcohol contributed to fights and even murders that would not have occurred otherwise. Add handguns into these disputes and you have more people dying of bullet wounds.
Below, I display an updated figure of the standardized trends in drug overdose deaths, alcohol consumption-related deaths, firearm sales, and the homicide rate. I extend these estimates into 2025 by extrapolating from early monthly data from this year.9 As is apparent, these trends have closely followed each other since the early fentanyl epidemic, circa 2013.
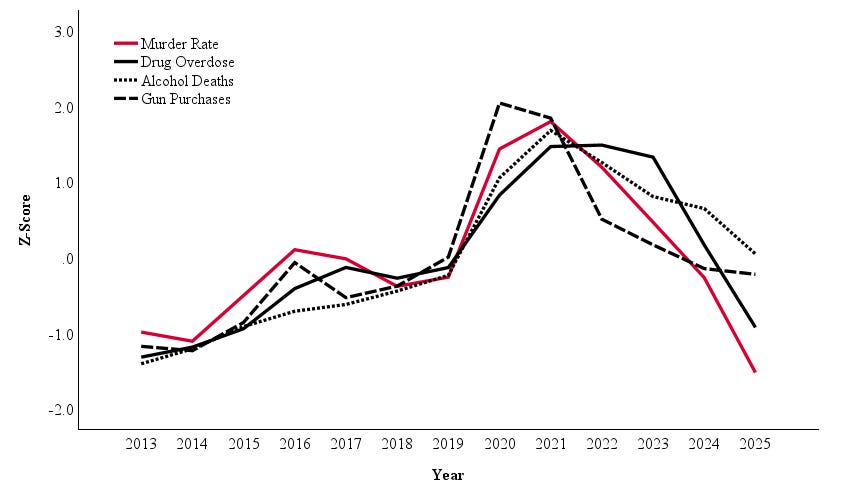
From 2013 to 2025, annual change in the national murder rate is strongly correlated with drug overdoses (r = .86), alcohol-related deaths (r = .93), and firearm purchases (r = .79). As you can see from the figure above, homicide rates in 2023 and 2024 appear to be declining even faster than other trends. We are currently experiencing a ‘correction’ of sorts of the homicide rate.
Part 3. The Murder Rate ‘Correction’
To borrow a phrase from financial investing, we are now seeing the over-heated murder market, driven by drugs, alcohol, and guns, experience a ‘correction.’ Probably the best metric to base homicide ‘fundamentals’ on is the robbery rate given their close historical association.
In the figure below, I display the robbery to homicide ratio from 1960 to 2023. In this figure, I also extend this data to 2025 using AH Analytics city data. While the robbery to murder ratio was nearly as low in the 1960s as it is today, I attribute this to missing and incomplete data during early eras. From 1974 to 2015, the robbery to murder ratio was always at least 20:1 or greater. From 2015 onward, there was a steep drop, which has rebounded as murder rates have fallen for the past three years. By the end of 2025, the ratio may nearly reach 15:1.
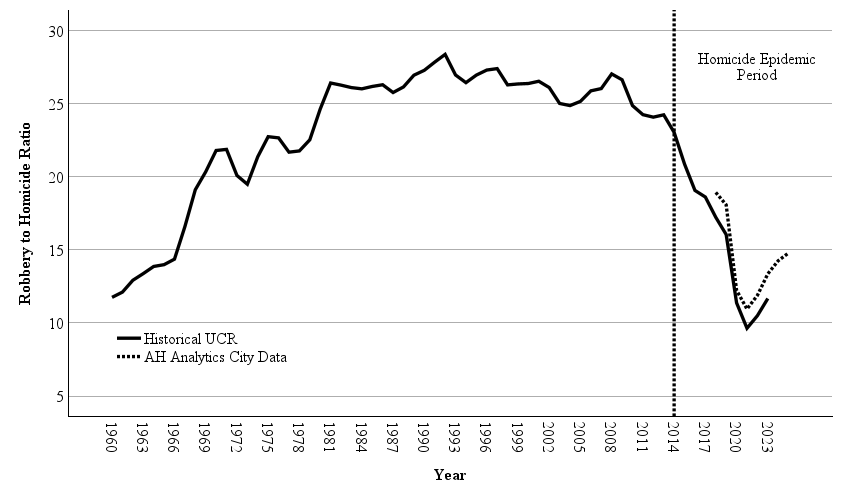
This implies that there will continue to be a homicide rate ‘correction’ in the near future. I doubt that we will reach the more than 25:1 robbery-to-murder ratio heights of the 1980s and 1990s, but it would be reasonable to expect a 20:1 ratio in coming years. If robbery rates do not substantially increase, the homicide rate would need to fall well below 4 per 100,000 to achieve this ratio. The estimated robbery rate in 2023 was 66.5 per 100,000; preliminary data suggests it may have fallen further by 2025. These trends would imply the homicide rate could fall to nearly 3 per 100,000 by the end of the 2020s.
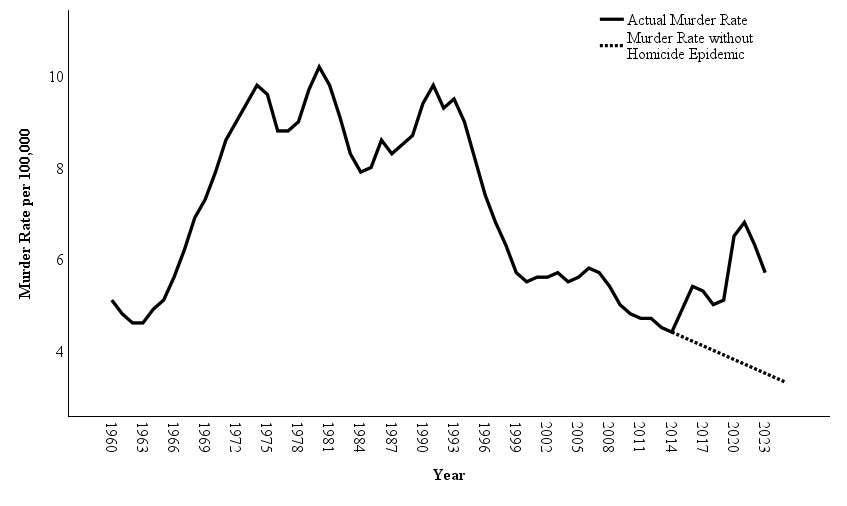
Another somewhat crude way of estimating how low the homicide rate should be is to project the homicide trend from 2010 through 2014 to 2025. That is, I projected the homicide trend from 2010 to 2014 through 2025 as if the gun/drug/alcohol homicide epidemic never occurred. On average, we would expect the homicide rate to decline by about 0.1 homicide per 100,000 each year since 2014. The figure below displays this estimate against the actual homicide trend. This method suggests that the homicide rate would at or below 3.5 murders per 100,000 in 2025.
Part 4. Where is the Floor?
Declines do not go on forever; there is a “floor.” Where exactly that floor is is not easy to determine. There are some reasons to believe it could be quite low as today’s youth are the least represented cohort in arrest statistics since we began tracking in the 1930s.
On the other hand, there are other reasons to believe that we might hit that floor soon. One reason that crime rates might not fall much further is that they are already near historic lows. This fact alone would be suggestive that we are at or near the floor.
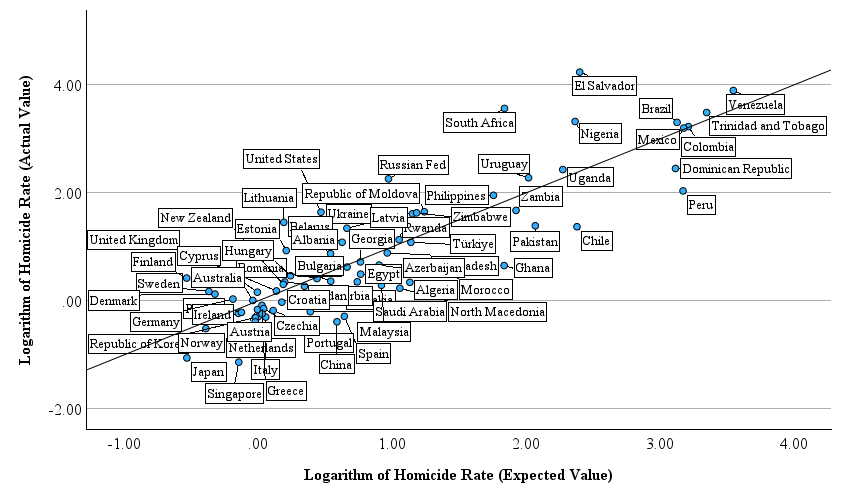
We don’t have very good international data for overall crime rates, but murder rate comparisons are common. Below, I examined a variation in homicide rates (converted to a logarithm). After accounting for a few relevant factors, we can see that homicide rates in the United States are a bit higher (actual value) than we would expect (expected/predicted value). Nations that are close to the U.S. in predicted/expected values are often located in Eastern Europe (Hungary, Bulgaria, Georgia, etc.). This would suggest our homicide rate could come down below 3 per 100,000, depending upon which nation is selected as comparison.10
If I were to guess, I think 3 per 100,000 is our floor during the next decade. We might not even quite get there. America’s long-entrenched issues with racialized poverty make it somewhat unique among wealthy nations. But, it is very possible that 3.5 homicides per 100,000, a figure that is more than 20% lower than ever recorded in the U.S., is where we are headed by the late 2020s.
Part 5. Caveats and Unknowns
There are some crime trends that do not neatly fit into this narrative. Most prominently, there was a sharp rise in motor vehicle theft from 2021 through 2023. Some of this may have been driven by inflation, as prices for used cars skyrocketed during this period. There may have also been some contribution of the so-called ‘Kia Boyz’ - which grew out of a Tik Tok trend. Someone discovered (and shared) a relatively easy way to steal some models of Kia and Hyundai - which may have lead to thousands of stolen cars across the United States.
Car thefts are on the decline again, but it is worth noting that motor vehicle theft trends have departed from robbery and burglary trends at times during the past decade.
Predicting the crime trend is also notoriously difficult. Something unexpected could occur and completely reverse the trends that I have outlined here. What if there is a sudden resurgence of the drug epidemic? What if political instability in the United States worsens? What if Gen Alpha (as teenagers) begins committing crime at a higher rate than Gen Z? While I don’t think these things will happen or increase crime trends in the near future, they are certainly possible.
As the homicide epidemic chapter draws to a close over the coming years, I will not be as unique in my ability to predict the annual homicide trend. As homicide rates re-converge with robbery trends, my focus on trends in drugs, alcohol, and guns will tell me less and less about where the homicide trend is headed. Murder will go back to being just another street crime, following same trends as crime rates overall.
Summary and Conclusion
Crime rates have been falling for more than a decade, largely due to a youth cohort that is less prone to offending than any other in modern history. Between 2015 and 2021, the homicide trend momentarily defied the crime decline due to expanding illicit drug markets, alcohol consumption, and firearm availability. Now that these trends are in decline, the homicide rate is going into a ‘correction’ of sorts. In 2025, the homicide rate will be the lowest since 1959. The homicide decline will likely decelerate after 2025, but by 2026 or 2027, the homicide rate may be the lowest ever recorded in the post-World War II era.
Monthly 2025 crime data derived from AH Analytics: https://www.ahdatalytics.com/dashboards/. The proportional decline from 2024’s homicide rate is calculated using this data and then applied to the CDC assault mortality data to produce this estimate.
Tuttle, J. (2025). Crime Wave: The American Homicide Epidemic. New York University Press.
Osgood, D. W. (2023). Delinquency, unstructured socializing, and social change: The rise and fall of a teen culture of independence. Criminology, 61(4), 681-704.
The 2000-2019 arrest statistics are from annual Uniform Crime Reports compiled by the FBI. The 2020 through 2023 statistics were derived from the Crime Data Explorer website. The 2021 and 2022 data are linear interpolated as missingness during those years of transition between the UCR and NIBRS systems is apparent. The teen birth data is from the CDC, standardized by 1,000 population of females aged 15 to 19.
Tuttle, J. (2024). The end of the age-crime curve? A historical comparison of male arrest rates in the United States, 1985-2019. British Journal of Criminology, 64(3), 638-655.
White collar offending and scamming is, on the other hand, having a bit of a renaissance. As some commentators have put it - crime is legal.
Rosenfeld, R. (2009). Crime is the problem: Homicide, acquisitive crime, and economic conditions. Journal of Quantitative Criminology, 25(3), 287-306.
Projections for 2024 and 2025 are made using the proportional national change noted in AH Analytics city data (https://www.ahdatalytics.com/dashboards/).
The homicide data extrapolation is described in footnote 1, in this case using the FBI’s homicide estimates rather than the CDC’s. The drug overdose data is based on January and February’s provisional overdose CDC estimates found here. The firearm purchase data through June was available to extend the annual estimate, found here. The alcohol-related death data is available in a (largely complete) provisional form through May of this year on the CDC Wonder database.
The regression model included infant mortality (a proxy for poverty rates), inflation, ethnic fractionalization, percent urban, governance quality, and a dummy variable to account for high violence in ‘Latin American’ countries.
Fascinating. Boomer here, and I can’t help but notice my young adult years coinciding with peak crime in the US, which feels about right. Not data driven, but I cannot help the feeling that my gen was more adventurous than current gens. Not because we were better, but because the world was “out there” and if you wanted a piece of it, you had to go find it. Now devices/interwebs provide the illusion of access to the world without the expense/trouble/risk of actually going there?
cheers. thanks for the youth cohort falling criminality point. but is there any effect from falling relative populations of youth, full stop? median age is rising and people live longer and have less kids. and we know impulsive criminality burns out by the 50s.